Infrastructure monitoring with Grafana, InfluxDB and Telegraf
 Architecture
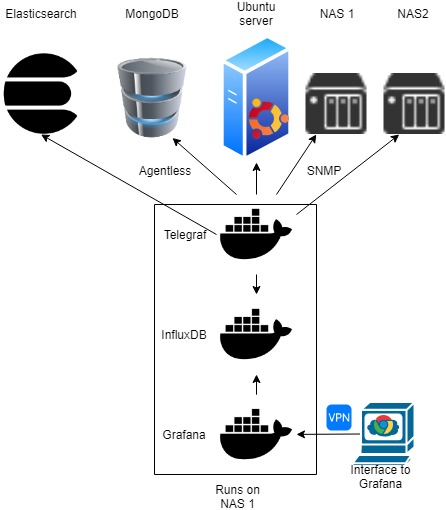
In this article, I would like to share my expirence in how to monitor an IT infrastrutre visual with Grafana. The picture below shows the current architecture. The main components are Telegraf for statistics collection, InfluxDB as the database storage for statictics, and Grafana server which hosts the visualisation engine including a web server to access the visualised system metrics. All these components are running in a docker container on NAS 1.
Some details on how to setup Telegraf and Grafana can be found in the sub chapters below. For testing purposes, the stack below can be also installed locally. Install Telegraf, InfluxDB and Grafana on MacOS
Docker
All used docker container are based on the avilable online docker repositories and run on my own server.
Telegrad Docker InfluxDB Docker Grafana Docker
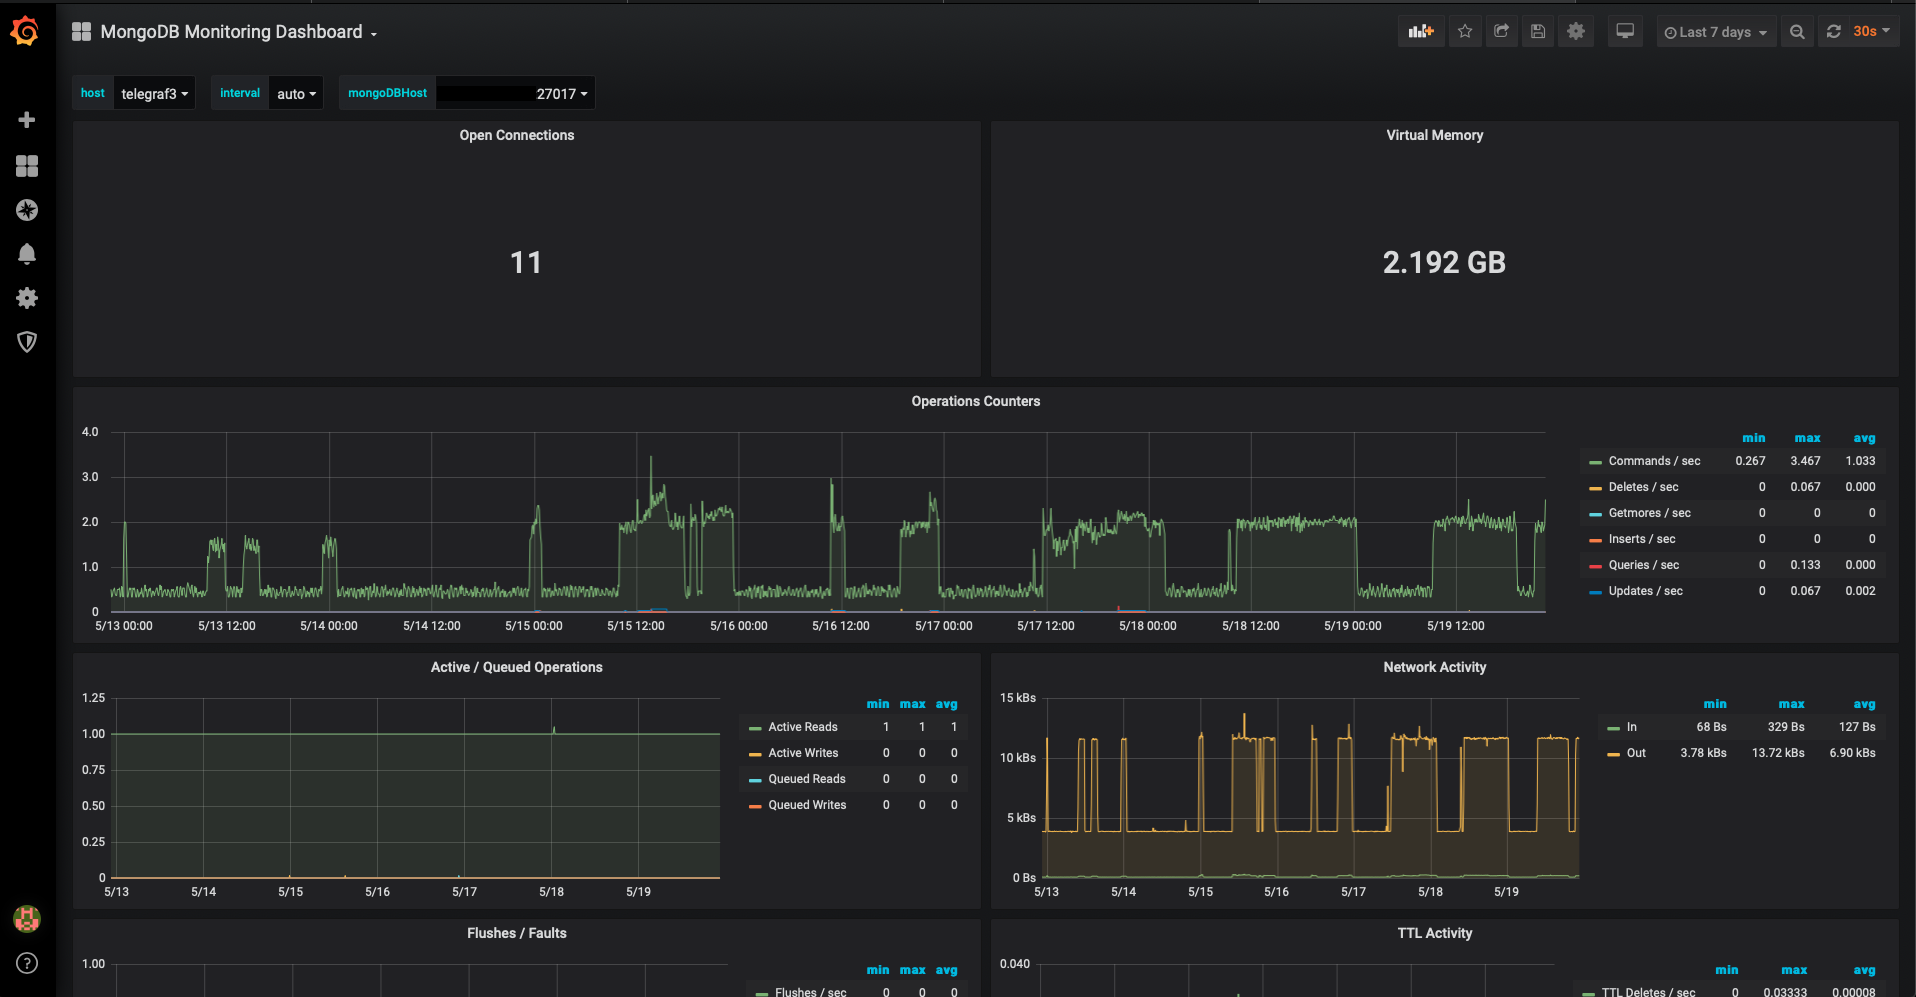
Visualize MongoDB statistics
To gather the MongoDB statictics, Telegraf itself is used. Please see the configuration on Telefraf below.
Dashboard is based on Grafana dashboard templates
Config for telegraf ‘/etc/telegraf/telegraf.config’
servers = ["mongodb://USERNAME:PASS@XXX.XXX.XXX.XXX:27017",
"mongodb://USERNAME_of_Server2:PASS2@XXX.XXX.XXX.XXX:27017"]
  ## When true, collect per database stats
  # gather_perdb_stats = false
  ## When true, collect per collection stats
  # gather_col_stats = false
  ## List of db where collections stats are collected If empty, all db are concerned
  # col_stats_dbs = ["local"]
  ## Optional TLS Config
  # tls_ca = "/etc/telegraf/ca.pem" tls_cert = "/etc/telegraf/cert.pem" tls_key = "/etc/telegraf/key.pem"
  ## Use TLS but skip chain & host verification
  # insecure_skip_verify = false
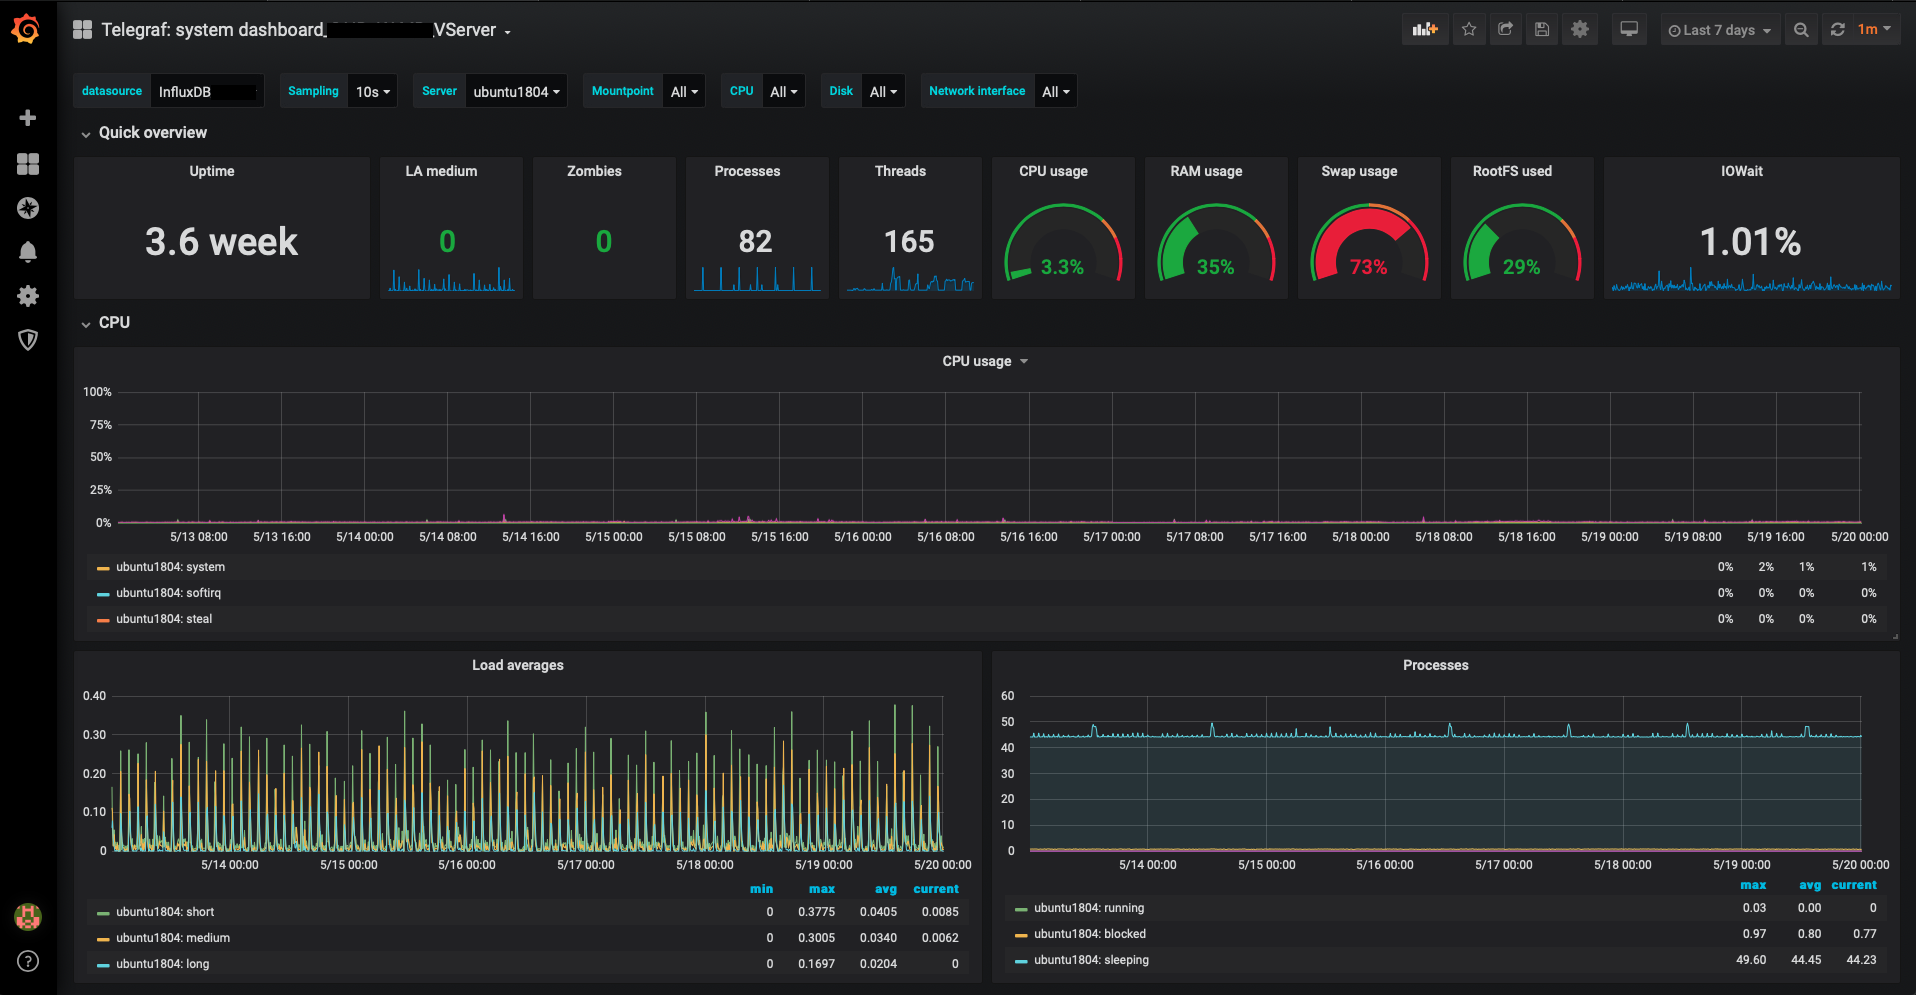
Visualize Ubuntu server statistics
To monitor the Ubuntu server, I used telegraf itself as an agent to monitor the system. This means I installed Telegraf on the system which by default collects statitics of the host system and send them to InfluxDB.
Installing Telegraf Based on grafana dashboard templates
Visualize of Synology NAS statistics
To collect data from Synology I used SNMP and the provided MiBs directly from Synology (see links and telegraf SNMP configuration below).
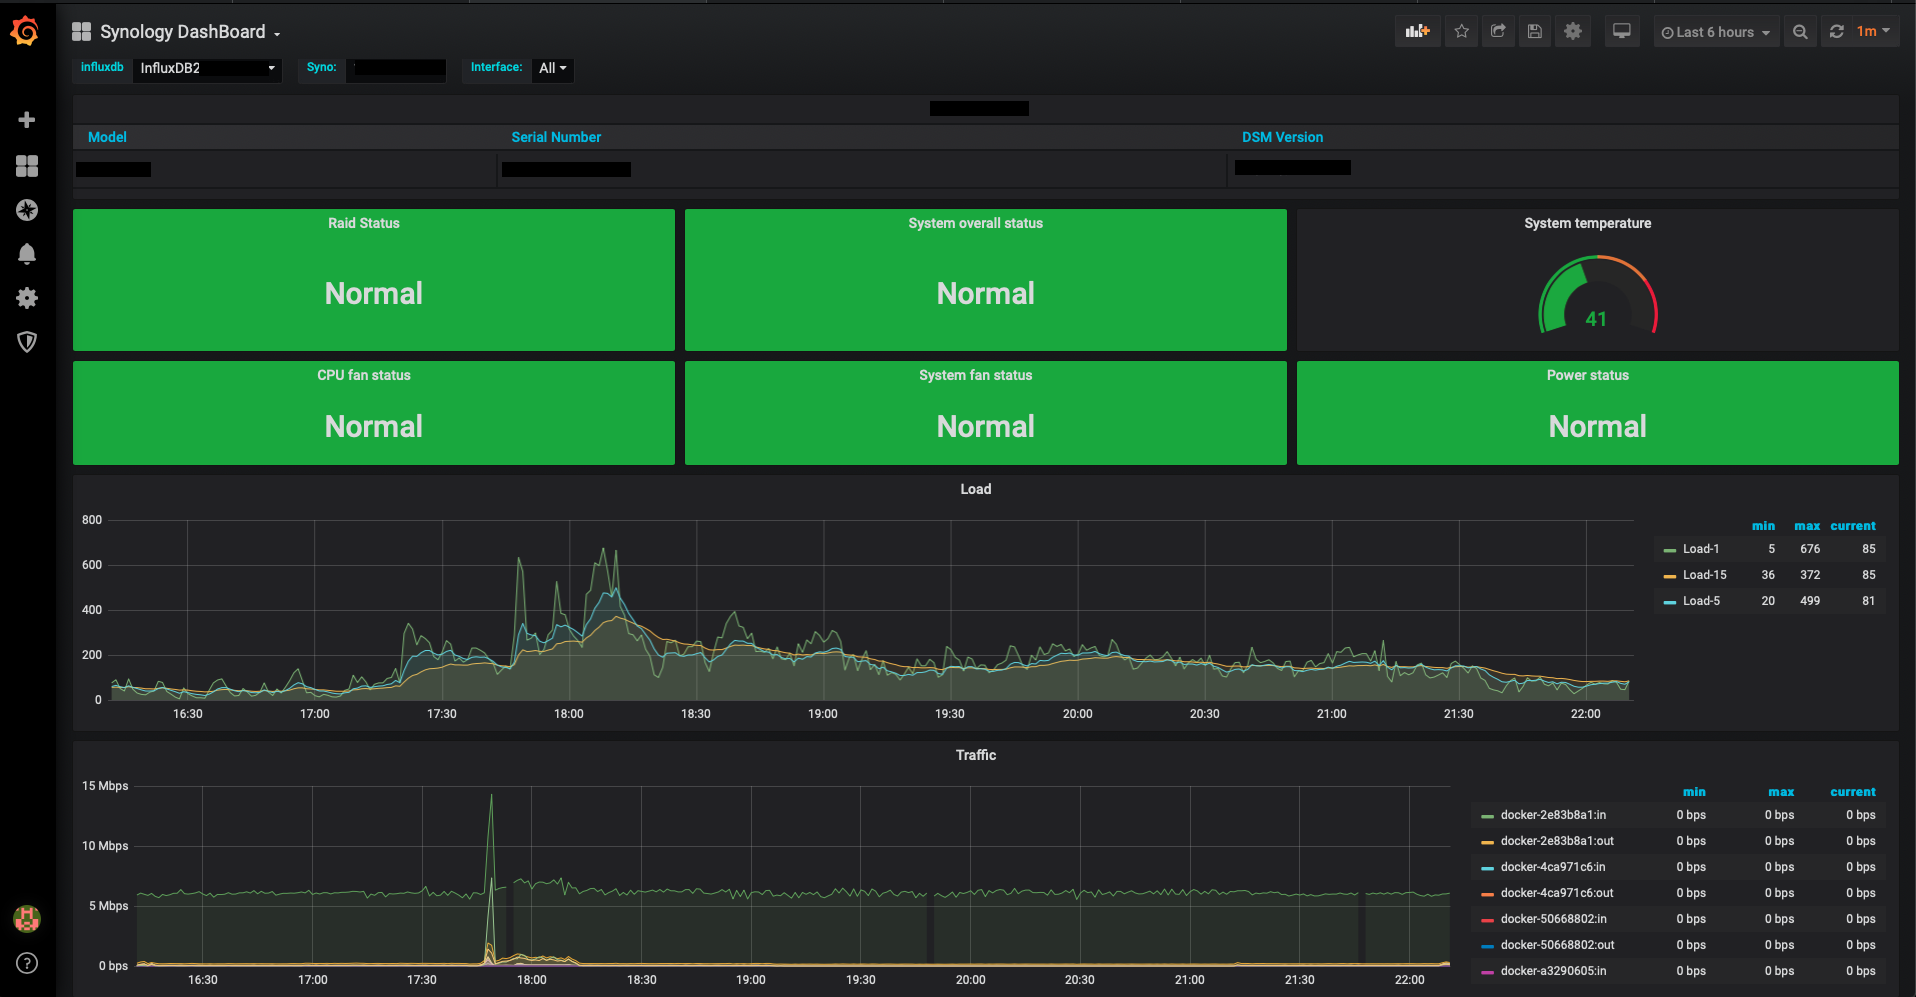
Synology SNMP MIB Guide Synology SNMP MiB files Dashboard is based on grafana templates
Telegraf config based on ‘jsoref’ Github
Config for telegraf ‘/etc/telegraf/telegraf.config’
###############################################################################
#                            INPUT PLUGINS-Synology                                    #
###############################################################################
##
## Retrieves details via SNMP from Synology NAS
##

##
## Synology
##
 [[inputs.snmp]]
   # List of agents to poll
   agents = [  "XXX.XXX.XXX.XXX", "XXX.XXX.XXX" ] #<----------Edit this (Server1, Server2)
   # Polling interval
   interval = "60s"
   # Timeout for each SNMP query.
   timeout = "10s"
   # Number of retries to attempt within timeout.
   retries = 3
   # SNMP version, UAP only supports v1
   version = 2
   # SNMP community string.
   community = "public"
   # The GETBULK max-repetitions parameter
   max_repetitions = 30
   # Measurement name
   name = "snmp.SYNO"
   ##
   ## System Details
   ##
   #  System name (hostname)
   [[inputs.snmp.field]]
     is_tag = true
     name = "sysName"
     oid = "RFC1213-MIB::sysName.0"
   #  System vendor OID
   [[inputs.snmp.field]]
     name = "sysObjectID"
     oid = "RFC1213-MIB::sysObjectID.0"
   #  System description
   [[inputs.snmp.field]]
     name = "sysDescr"
     oid = "RFC1213-MIB::sysDescr.0"
   #  System contact
   [[inputs.snmp.field]]
     name = "sysContact"
     oid = "RFC1213-MIB::sysContact.0"
   #  System location
   [[inputs.snmp.field]]
     name = "sysLocation"
     oid = "RFC1213-MIB::sysLocation.0"
   #  System uptime
   [[inputs.snmp.field]]
     name = "sysUpTime"
     oid = "RFC1213-MIB::sysUpTime.0"
   # Inet interface
   [[inputs.snmp.table]]
     oid = "IF-MIB::ifTable"
     [[inputs.snmp.table.field]]
       is_tag = true
     oid = "IF-MIB::ifDescr"
   #Syno disk
   [[inputs.snmp.table]]
     oid = "SYNOLOGY-DISK-MIB::diskTable"
     [[inputs.snmp.table.field]]
       is_tag = true
     oid = "SYNOLOGY-DISK-MIB::diskID"
   #Syno raid
   [[inputs.snmp.table]]
     oid = "SYNOLOGY-RAID-MIB::raidTable"
     [[inputs.snmp.table.field]]
       is_tag = true
     oid = "SYNOLOGY-RAID-MIB::raidName"
   #Syno load
   [[inputs.snmp.table]]
     oid = "UCD-SNMP-MIB::laTable"
     [[inputs.snmp.table.field]]
       is_tag = true
     oid = "UCD-SNMP-MIB::laNames"
   #  System memTotalSwap
   [[inputs.snmp.field]]
     name = "memTotalSwap"
     oid = "UCD-SNMP-MIB::memTotalSwap.0"
   #  System memAvailSwap
   [[inputs.snmp.field]]
     name = "memAvailSwap"
     oid = "UCD-SNMP-MIB::memAvailSwap.0"
   #  System memTotalReal
   [[inputs.snmp.field]]
     name = "memTotalReal"
     oid = "UCD-SNMP-MIB::memTotalReal.0"
   #  System memAvailReal
   [[inputs.snmp.field]]
     name = "memAvailReal"
     oid = "UCD-SNMP-MIB::memAvailReal.0"
   #  System memTotalFree
   [[inputs.snmp.field]]
   name = "memTotalFree"
     oid = "UCD-SNMP-MIB::memTotalFree.0"
   #  System Status
   [[inputs.snmp.field]]
     name = "systemStatus"
     oid = "SYNOLOGY-SYSTEM-MIB::systemStatus.0"
   #  System temperature
   [[inputs.snmp.field]]
     name = "temperature"
     oid = "SYNOLOGY-SYSTEM-MIB::temperature.0"
   #  System powerStatus
   [[inputs.snmp.field]]
     name = "powerStatus"
     oid = "SYNOLOGY-SYSTEM-MIB::powerStatus.0"
   #  System systemFanStatus
   [[inputs.snmp.field]]
     name = "systemFanStatus"
     oid = "SYNOLOGY-SYSTEM-MIB::systemFanStatus.0"
   #  System cpuFanStatus
   [[inputs.snmp.field]]
     name = "cpuFanStatus"
      oid = "SYNOLOGY-SYSTEM-MIB::cpuFanStatus.0"
   #  System modelName
   [[inputs.snmp.field]]
     name = "modelName"
     oid = "SYNOLOGY-SYSTEM-MIB::modelName.0"
   #  System serialNumber
   [[inputs.snmp.field]]
     name = "serialNumber"
     oid = "SYNOLOGY-SYSTEM-MIB::serialNumber.0"
   #  System version
   [[inputs.snmp.field]]
     name = "version"
     oid = "SYNOLOGY-SYSTEM-MIB::version.0"
   #  System upgradeAvailable
   [[inputs.snmp.field]]
     name = "upgradeAvailable"
     oid = "SYNOLOGY-SYSTEM-MIB::upgradeAvailable.0"
   # System volume
   [[inputs.snmp.table]]
     oid = "HOST-RESOURCES-MIB::hrStorageTable"
   [[inputs.snmp.table.field]]
       is_tag = true
     oid = "HOST-RESOURCES-MIB::hrStorageDescr"
   # System ssCpuUser
   [[inputs.snmp.field]]
     name = "ssCpuUser"
     oid = ".1.3.6.1.4.1.2021.11.9.0"
   # System ssCpuSystem
   [[inputs.snmp.field]]
     name = "ssCpuSystem"
     oid = ".1.3.6.1.4.1.2021.11.10.0"
   # System ssCpuIdle
   [[inputs.snmp.field]]
     name = "ssCpuIdle"
     oid = ".1.3.6.1.4.1.2021.11.11.0"
   # Service users CIFS
   [[inputs.snmp.table.field]]
     name = "usersCIFS"
     oid = "SYNOLOGY-SERVICES-MIB::serviceUsers"
     oid_index_suffix = "1"
   # Service users AFP
   [[inputs.snmp.table.field]]
     name = "usersAFP"
     oid = "SYNOLOGY-SERVICES-MIB::serviceUsers"
     oid_index_suffix = "2"
   # Service users NFS
   [[inputs.snmp.table.field]]
     name = "usersNFS"
     oid = "SYNOLOGY-SERVICES-MIB::serviceUsers"
     oid_index_suffix = "3"
   # Service users FTP
   [[inputs.snmp.table.field]]
     name = "usersFTP"
     oid = "SYNOLOGY-SERVICES-MIB::serviceUsers"
     oid_index_suffix = "4"
   # Service users SFTP
   [[inputs.snmp.table.field]]
     name = "usersSFTP"
     oid = "SYNOLOGY-SERVICES-MIB::serviceUsers"
     oid_index_suffix = "5"
   # Service users HTTP
   [[inputs.snmp.table.field]]
     name = "usersHTTP"
     oid = "SYNOLOGY-SERVICES-MIB::serviceUsers"
     oid_index_suffix = "6"
   # Service users TELNET
   [[inputs.snmp.table.field]]
     name = "usersTELNET"
     oid = "SYNOLOGY-SERVICES-MIB::serviceUsers"
     oid_index_suffix = "7"
   # Service users SSH
   [[inputs.snmp.table.field]]
     name = "usersSSH"
     oid = "SYNOLOGY-SERVICES-MIB::serviceUsers"
     oid_index_suffix = "8"
   # Service users OTHER
   [[inputs.snmp.table.field]]
     name = "usersOTHER"
     oid = "SYNOLOGY-SERVICES-MIB::serviceUsers"
     oid_index_suffix = "9"
   # UPS Status
   [[inputs.snmp.table.field]]
     name = "upsStatus"
     oid = "SYNOLOGY-UPS-MIB::upsInfoStatus"
   # UPS Load
   [[inputs.snmp.table.field]]
     name = "upsLoad"
     oid = "SYNOLOGY-UPS-MIB::upsInfoLoadValue"
   # UPS Battery Charge
   [[inputs.snmp.table.field]]
     name = "upsCharge"
     oid = "SYNOLOGY-UPS-MIB::upsBatteryChargeValue"
   # UPS Battery Charge Warning
   [[inputs.snmp.table.field]]
     name = "upsWarning"
     oid = "SYNOLOGY-UPS-MIB::upsBatteryChargeWarning"
   # Disks statistics
   [[inputs.snmp.table]]
     oid = "SYNOLOGY-STORAGEIO-MIB::storageIOTable"
     [[inputs.snmp.table.field]]
       is_tag = true
     oid = "SYNOLOGY-STORAGEIO-MIB::storageIODevice"
Telegraf output configuration
To send and store collected data, Telegraf sends this data to InfluxDB. Please see the configuration of Telegraf below.
Config for telegraf ‘/etc/telegraf/telegraf.config’
###############################################################################
#                            OUTPUT PLUGINS                                   #
###############################################################################


# Configuration for sending metrics to InfluxDB
[[outputs.influxdb]]
  ## The full HTTP or UDP URL for your InfluxDB instance.
  ##
  ## Multiple URLs can be specified for a single cluster, only ONE of the
  ## urls will be written to each interval.
  # urls = ["unix:///var/run/influxdb.sock"]
  # urls = ["udp://127.0.0.1:8089"]
   urls = ["http://XXX.XXX.XXX.XXX:23000"] #<---------------------------- Edit this

  ## The target database for metrics; will be created as needed.
  ## For UDP url endpoint database needs to be configured on server side.
  # database = "telegraf"

  ## The value of this tag will be used to determine the database.  If this
  ## tag is not set the 'database' option is used as the default.
  # database_tag = ""

  ## If true, the 'database_tag' will not be included in the written metric.
  # exclude_database_tag = false

  ## If true, no CREATE DATABASE queries will be sent.  Set to true when using
  ## Telegraf with a user without permissions to create databases or when the
  ## database already exists.
  # skip_database_creation = false

  ## Name of existing retention policy to write to.  Empty string writes to
  ## the default retention policy.  Only takes effect when using HTTP.
  # retention_policy = ""

  ## The value of this tag will be used to determine the retention policy.  If this
  ## tag is not set the 'retention_policy' option is used as the default.
  # retention_policy_tag = ""

  ## If true, the 'retention_policy_tag' will not be included in the written metric.
  # exclude_retention_policy_tag = false

  ## Write consistency (clusters only), can be: "any", "one", "quorum", "all".
  ## Only takes effect when using HTTP.
  # write_consistency = "any"

  ## Timeout for HTTP messages.
  # timeout = "5s"

  ## HTTP Basic Auth
  # username = "telegraf" #<---------------------------- Edit this
  # password = "metricsmetricsmetricsmetrics" #<---------------------------- Edit this

  ## HTTP User-Agent
  # user_agent = "telegraf"

  ## UDP payload size is the maximum packet size to send.
  # udp_payload = "512B"

  ## Optional TLS Config for use on HTTP connections.#<---------------------------- Edit this
  # tls_ca = "/etc/telegraf/ca.pem"
  # tls_cert = "/etc/telegraf/cert.pem"
  # tls_key = "/etc/telegraf/key.pem"
  ## Use TLS but skip chain & host verification
  # insecure_skip_verify = false

  ## HTTP Proxy override, if unset values the standard proxy environment
  ## variables are consulted to determine which proxy, if any, should be used.
  # http_proxy = "http://corporate.proxy:3128"

  ## Additional HTTP headers
  # http_headers = {"X-Special-Header" = "Special-Value"}

  ## HTTP Content-Encoding for write request body, can be set to "gzip" to
  ## compress body or "identity" to apply no encoding.
  # content_encoding = "identity"

  ## When true, Telegraf will output unsigned integers as unsigned values,
  ## i.e.: "42u".  You will need a version of InfluxDB supporting unsigned
  ## integer values.  Enabling this option will result in field type errors if
  ## existing data has been written.
  # influx_uint_support = false
Elasticsearch
Config for telegraf ‘/etc/telegraf/telegraf.config’
[[inputs.elasticsearch]]
  ## specify a list of one or more Elasticsearch servers you can add username and password to your url to use basic
  ## authentication: servers = ["http://user:pass@localhost:9200"]
  servers = ["http://user:passXXX.XXX.XXX.XXX:9200"]   #<-------- Edit this!
  ## Timeout for HTTP requests to the elastic search server(s)
  http_timeout = "5s"
  ## When local is true (the default), the node will read only its own stats. Set local to false when you want to
  ## read the node stats from all nodes of the cluster.
  local = true
  ## Set cluster_health to true when you want to obtain cluster health stats
  cluster_health = true
  ## Adjust cluster_health_level when you want to obtain detailed health stats The options are
  ##  - indices (default) - cluster
  # cluster_health_level = "indices"
  ## Set cluster_stats to true when you want to obtain cluster stats.
  cluster_stats = true
  ## Only gather cluster_stats from the master node. To work this require local = true
  cluster_stats_only_from_master = true
  ## Indices to collect; can be one or more indices names or _all
  indices_include = ["_all"]
  ## One of "shards", "cluster", "indices" Currently only "shards" is implemented
  indices_level = "shards"
  ## node_stats is a list of sub-stats that you want to have gathered. Valid options are "indices", "os",
  ## "process", "jvm", "thread_pool", "fs", "transport", "http", "breaker". Per default, all stats are gathered.
  # node_stats = ["jvm", "http"]
  ## HTTP Basic Authentication username and password.
  # username = "" password = ""
  ## Optional TLS Config
  # tls_ca = "/etc/telegraf/ca.pem" tls_cert = "/etc/telegraf/cert.pem" tls_key = "/etc/telegraf/key.pem"
  ## Use TLS but skip chain & host verification
  # insecure_skip_verify = false
Grafana
To access the data in InfluxDB with Grafana, it is necessary to first connect to a data source (in this case it is InfluxDB). Please find a step-by-step guide on Grafana.com Add a data source in Grafana Use InfluxDB in Grafana
After adding a data source, it is necessary to build your own dashboard to visualise the data out of InfluxDB or use a template from Grafana.com. Importing a Grafana dashboard template
With the standard configuration the dashboard should visulize the data without any furter configurations.